Dear Members,
MARKET UPDATE: 11 JANUARY 2016
| NIFTY |
|
|
|
|
| TIME | TARGET | TREND | REVERSAL | TIME |
| Medium term trend | 7353 or 7700 | N/A | 7550 | 1-4 Weeks |
Explanatory Note :
7550 is going to be important, I am
not concluding here but giving a lot of evidence why it might still hold out.
MEDIUM TERM TREND
Panic is in the wind and under those circumstances oversold readings and levels can sometimes fail to work. But there is no change in what I have been observing in the market for a while. Despite the decline from 9100 to 7550, the Midcap/Smallcap indices
continue to outperform and the A/D ratio which was falling last year is now rising with strength in the very stocks and sectors that were the weakest last year. These trends are mostly associated with a selling climax or the final panic rather than the start of a trend.
-----------------------------------------------------------------------------------------------------------------------
The second factor that people
panic about are junk bonds because Oil prices are falling and maybe a lot of Oil companies especially in the US would default on them. But usually only a few will go under and the rest will survive on the reduced capacity. That said despite the new low in oil the popular high yields contract called JNK did not fall to a new low this week. I discussed this contract in the Long Short Report.

The next source of Panic is the USDCNY, a rising price reflect the falling Chinese Yuan, the contract from the bottom in Nov 2014 is in wave 5 up and in wave v of 5 with an RSI of
88. So you know how overbought that is. Yes prices can extend but this is not a level at which I call for an up move. Long term readers know I was warning of a panic related to the Yuan all year long, but this appears late in this trend right now. But yes till it reverses it is the ongoing theme of the moment. This can reverse any time.

The CRB index of commodities topped in 2008 formed wave A and B into 2011. Wave B was exactly 61.8% of wave A. Wave C is almost equal to wave A and as shown below in wave 5 of C. So this is the last leg barring a few points here or there. Sentiment in single digits and
the turnaround in Gold are early pointers to a bottom in commodities for some time to come. Fundamentals will always lag prices. So I do not want to get into the fundamental argument of what is wrong with commodities because else prices would not be down. Did you know these things where the CRB index was at the peak in 2011? The technical position is of wave C ending and panic is overdone here. Dec-Jan is a seasonal bottoming period for commodities as well. Agro commodities have also been in 5
year long bear markets that maybe ending.

The real question is on the level of panic in our own market. Prices have been declining for more than a year in
stocks and 3 quarters in Nifty [large caps]. The turnaround in stocks is visible in the following chart which shows the positive divergence in favor of the Midcaps. Recently I ran a test of the no of stocks that are above the 20dma. Remember I ran this test in June and the results showed that the Nifty was rising after the Modi election despite a large number of stocks declining back below their 200dma. This trend was prevalent from July 2014 to Sept 2015. But for the Dec 2015 quarter for the
first time the data changed and moved up. As a larger number of stocks picked up from the extreme lows.

The Midcap v/s Nifty chart below also shows the recent inter
market divergences in price.

So when the Midcap index fell this week it retraced exactly 61.8% of the entire recent rise from the Dec low. The
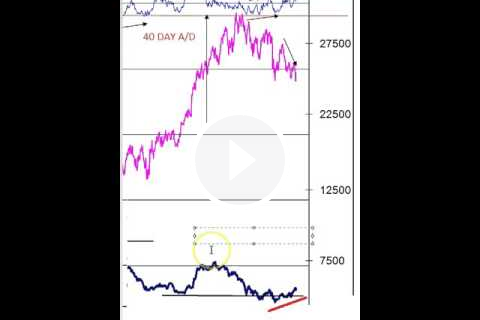
best interpretation is that this is wave 2 of C as shown below, till the recent low and the rising blue trendline are not broken. A break would make the fall appear 5 waves down and then the trend would be down till proven otherwise. Note even on Friday over 2000 stocks advanced on the BSE and the breadth was strong. Earlier in the week I highlighted in the Long Short update that the A/D 40 was strong and it continued to be till the end of the week. The the breadth is not giving any sign of a
top.

For the Nifty I leave open the following interpretation. As long as the above divergences are true, 7550 should hold and we form a
triangle, but strength in the broad market and the Nifty movement has not exactly matched recently. A break of 7550 conclusively on more selling has one alternate that wave C of Z as shown below is forming where C=A points to 7353. This remains open and will have to be seen tomorrow. Wave Z is also the last leg of a decline so it is a selling climax. Will 7550 hold? Time will tell.