Nifty at a Key Level - Sugar Nasdaq Dollar Coffee Bonds Crude

Published: Wed, 07/05/17


Dear Members,

05 JULY 2017 

In May the Midcap indices closed down after a 4 month winning streak and in June all other indices did so after a 5 month winning streak. While a one month move does not change the trend you need to observe if wave counts complete something important. Also what are all technical indicators saying. Markets can always extend and add 4 more waves to a trend till they do not. You can either work with a trailing number or Position sizing. Can we go to 10350? It is the target of the twitterati. I watch out for a possible 5 wave decline from a end point of the 5+4+4 principle. What is 10350? this video explains this concept.

Also below the weekly EW outlook and other posts from Indiacharts. Feel free to share.


03 JULY 2017

The weekly Elliott Wave commentary with Targets and levels is published every Sunday to Subscribers, This is only an excerpt.

MEDIUM TERM

NIFTY ELLIOTT WAVE UPDATE 

The New high in Nifty this month was not confirmed by the Midcap and Smallcap indices this month. Inter market divergences galore precede market trend reversals. The rise in Sensex weekly shown below has 13 legs and an impulse wave has 5 legs or in case of extension 5+4=9 legs or 5+4+4 = 13 legs and so on. At 13 it is possible to mark a completed impulse wave unless more extentions show up. What does this mean?....  READ MORE

sensex030717


NSE IT - Sector Index View

Someone asked me on twitter to cover the IT index too. So why not. It is a slower moving index but I used this index as my poster boy for a top call on the IT sector for years. And it has finally rolled over. What was the basis for this view? It was the value wave framework which you can read here http://www.indiacharts.com/icjpages/index.php/indiamkts/valuewave 

Based on this a stock or sector peaks in a 3rd wave on the highest growth phase for it. Then the 5th and final wave long term is on weaker growth. This can be seen for the IT sectors falling Operating profits and profit growth. Infosys used to grow earnings at 100% and now does at 5%. Another feature of this market behaviour is when analysts call an old growth stock a defensive stock, it is in wave 5 long term. Now wave 5 can go up but it is terminal 2003-2016 is a long period for a 5th wave. But it did not go far above 2000, and also did not repeat the performance of the growth years. Worse is if I am right and you go back even 50% of wave 5. The impact on long term investment performance is significant. It was just not worth the exercise. This is the perspective that EW adds to where you are fundamentally in the cycle.

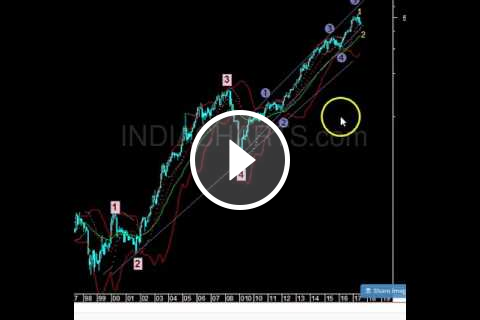
So the IT index ended wave 5 long term and completed waves 1 and 2 after that. 61.8% of the entire 5th wave is at 5572 near the wave D low as a conservative estimate of where the sector could bottom long term. We may review it there.

nseit020717

The near term chart shows wave 3 down in progress and the downward momentum will pick up below 10000. After that 3=1 would point to 8690 and 3=1.618 times wave 1 = 7800. These would both be open.

nseit020717a


Nasdaq 100

So while the Dow tested its highs again the Nasdaq was again pulled down as all the FANG stocks gave up. The Nasdaq 100 index broke the 29/06 swing low. The neckline of a h&s broken the pattern points to 5420.

nasdaq-040717


DAX

DAX - the German index has not confirmed a trend reversal on long term charts yet but it did form a doji star on the quarterly chart. That it did so after achieving the target of 5=1 shown by the box makes it an important candle to watch as the trend could be complete here.

dax-040717


Karachi 100

A very steep fall in the Karachi 100, and it is in wave 5/5, but the 5th wave did not achieve the Fibonacci or channel target. So I leave it open as to whether the final top is in or not. While possible ideally it should extend some more.

karachi-040717


US 30 year Treasury bonds

While the 10 year has already broken the rising channel 2 days ago the 30 year bonds are now at the rising trendline near 152. So a further decline in the bond market will get this second confirmation of a break down in the bond market. We would be at the start of a 3rd wave down in US bonds. [We have discussed this scenario and its impact in this months Long short report.]

bonds-040717


Soy Meal CBT

Soy Meal prices made a double bottom near 292$, and broke out of the falling trendine for wave of 2. A bottom maybe now in place for a larger 3rd wave up to start. Initial hurdle is 330 at 61.8% of Y. Then the X at 354 after that we should be heading to a new high above 432.Failure to go above 330 and 354 can keep us in wave 2 by some alternate patters.

soy-040717


BSE Auto Index

The Indian Auto sector was on a rage for years but the trend has been narrowing down in the last few years. The performance of stocks in the sector has also diverged. All this resulted in the Auto index completing an ending pattern in wave 5. If we close down for this month the high may have been put in for the Long term trend. A 5 wave rally from 2001 would be complete where 3<1 and 5<3. The Indian Auto sector stocks could then enter a deeper bear market.

auto-280617


Crude

While the breakout from the falling channel can mark a trend reversal, the wave counts leave open the possibility of one last push lower to complete a 5 wave decline in wave c. The 20dma at 45.20 needs to be crossed to rule this out else we drop from there to 42 or lower in wave v of c.

crude-29061


USDCAD

USDCAD - the last post identified the Wave B high at 61.8%. From there we have a 5 wave decline so the down trend is established. We may get the first retracement of the fall when the 5 wave decline completes but the larger trend down will resume again, till C=A is achieved. The RSI is getting oversold. 1.33 near the wave 4 high would be a resistance level during a counter trend move up. After that we may head to 1.25 in wave 3 of C.

usdcad-300617


Wheat CBT

After being bullish global wheat prices in my last update I was negative as prices reacted from the falling channel of the last few years. But we now have a breakout so it is best to stick to the original outlook. Wheat CBT should be in wave 3/3 up now. Staying above 470 the trend is up and the next two swing resistance levels are 524 and 615. The monthly Bollinger band is also near 500. So getting past the 500-524 range would expand volatility meaningfully.

wheat-300617


Coffee CSCE

Coffee prices bounced back from the oversold territory, meaning an RSI of below 30 on both the daily and weekly charts. The near term a falling trendline from the wave d high is at 131, so a move above 131 should be a final confirmation of a trend reversal. The quarterly chart below shows the big picture. The development of a triangle from 2010 onwards which is mostly wave B, and sets it up for wave C up a major new bull move for Coffee prices. Lets get a little imaginative here. If C=A is achieved over 5 years Coffee prices go to 700 from 125 now. That is quite crazy. The triangle breakout will be above 168. Note it is also possible that prices remain within the triangle for now and only go to 168 to come back to 120 again. So unless we breakout the triangle is still forming. For the year ahead however a move to 168 can be seen.

coffee-300617


Image

Don't WAIT for this update! GET Nifty Daily Weekly and the Monthly Long Short report and everything else directly in your mailbox

STAY AHEAD of the market turns. 3 Steps away. And WORTH many times more than what you pay.

Go here SUBSCRIBE NOW 

JOIN BUTTON

PAYPAL RECURRING 9$ PER MONTH 


~~~~~~~~~~~~~~~~~~~~~~~~~~~~~~~~~~~~~~~~~~~~~~~~~~~~~~~~~~~~~~
Rohit Srivastava
www.indiacharts.com
For accurate market forecasting. Market forecasting is a study of past data to assess
future probable outcomes. It is our endeavor to discuss high probability outcomes for
traders and investors. However this is not a solicitation to buy or sell stocks futures or
options or any security. Trading in any financial market should be done with sound
knowledge and the help of a qualified investment adviser. Stocks based on the Elliott
wave model are based on the Fibonacci fractal of the market and momentum indicators,
targets are based on Fibonacci maths and are only indicative of what the mathematical
model throws up. This is not a recommendation to buy/sell.
~~~~~~~~~~~~~~~~~~~~~~~~~~~~~~~~~~~~~~~~~~~~~~~~~~~~~~~~~~~~~~