A series of Extreme readings - US Equities

Published: Wed, 10/11/17


Dear Members,

11 Oct 2017

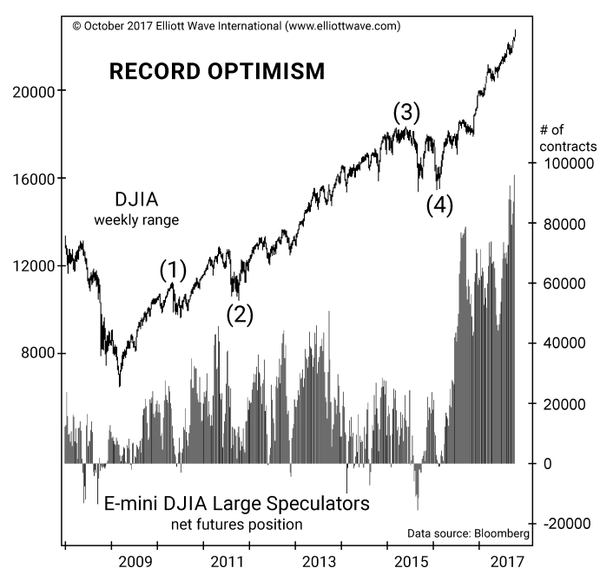
It is not that investors are all in as the extreme bets on short volatility and long equities simultaneously suggest but that everyone betting on it is doing so knowingly. Especially in case of India everyone knows the problems with the economy and everyone is well read about all and everything. They participate in the markets because they feel they have to. This is herding.

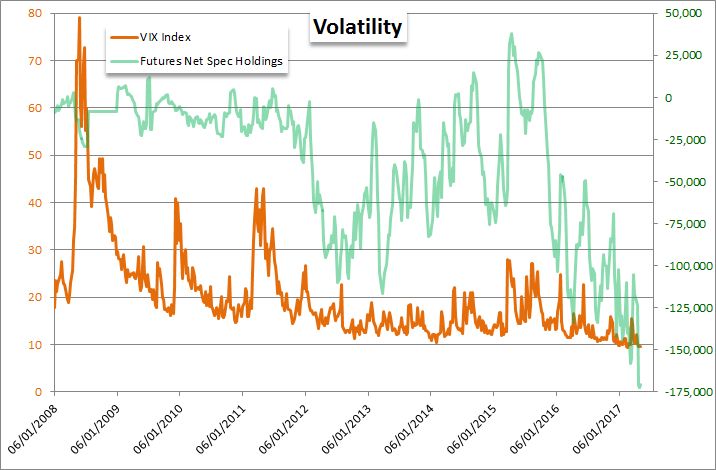
As a follow up to the post over the weekend here is a summary. Traders are betting the highest on record bearish volatility based on the net positions on VIX futures

 On Saturday i published a chart from Hedge Eye showing how the the Long Dow E-mini was the highest relative to other asset classes and also on the basis of a z score [standard deviations outside normal for the time given]. Here is a chart of the raw data from Elliott Wave Internationals recent Financial Forecast. This shows the longest positions on record for this contract as bulls go all in.
 An unusual indicator that I saw on social media is below, the use of 7 technical indicators to calculate fear and greed. You read and view more about it here http://money.cnn.com/data/fear-and-greed/
Image

Don't WAIT for this update! GET Nifty Daily Weekly and the Monthly Long Short report and everything else directly in your mailbox

STAY AHEAD of the market turns. 3 Steps away. And WORTH many times more than what you pay.

Go here SUBSCRIBE NOW 

JOIN BUTTON

CCAVENUE - 9$ / Rs.600 PER MONTH 


~~~~~~~~~~~~~~~~~~~~~~~~~~~~~~~~~~~~~~~~~~~~~~~~~~~~~~~~~~~~~~
Rohit Srivastava
www.indiacharts.com
For accurate market forecasting. Market forecasting is a study of past data to assess
future probable outcomes. It is our endeavor to discuss high probability outcomes for
traders and investors. However this is not a solicitation to buy or sell stocks futures or
options or any security. Trading in any financial market should be done with sound
knowledge and the help of a qualified investment adviser. Stocks based on the Elliott
wave model are based on the Fibonacci fractal of the market and momentum indicators,
targets are based on Fibonacci maths and are only indicative of what the mathematical
model throws up. This is not a recommendation to buy/sell.
~~~~~~~~~~~~~~~~~~~~~~~~~~~~~~~~~~~~~~~~~~~~~~~~~~~~~~~~~~~~~~