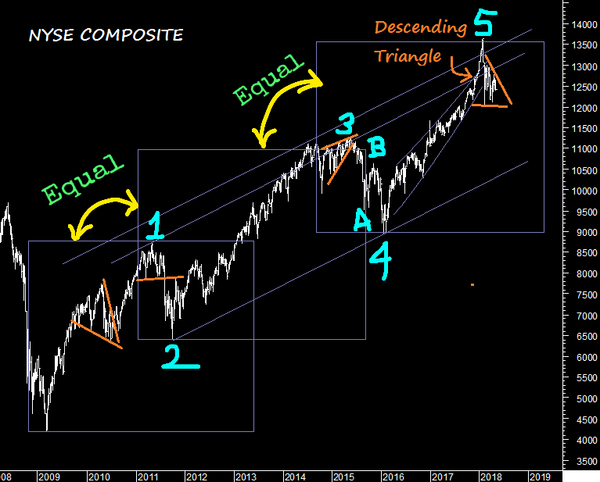
The NYSE Composite index is at a very important level, given the set up above. The US indices on an arithmetic scale show that
they fit a perfect channel with 5 waves where 1=3=5, is complete at the upper end. Wave 5 has been developing a triangle that Elliott wave analysts debate as a wave 4 phenomena and one last new high. But this set up above says that no further move higher is needed as the Fractal is complete. The triangle pattern on the Dow and the NYSE above is not the usual symmetrical triangle but more like a descending triangle [read John Magee for detailed description], a pattern of lower tops but multiple
lows that is more bearish in nature as it shows that bulls are unable to push markets higher despite several attempts.
This morning I published the following post on the US VIX that might help navigate the immediate trend.
CBOE VIX - After breaking out from the downtrend the US VIX is holding out at a higher base. 14.8% is where I have put the blue line. If the higher
bottom holds then it is indicative of a trend in higher volatility. The next move up in the VIX then would retest the 50% mark or go even higher. The fact that multiple rallies in the US have not relieved volatility to lower levels is signalling weakness ahead for US stocks.

In that light India VIX has gone back to where we were in Jan. Can it really stay down there. I doubt it and maybe it has far more to rise too. The recent drop in volatility might then be the greatest aberration in volatility that we are seeing, as Nifty under-prices
risk.

What has many traders confused is the falling dollar, as they believe that a weak dollar is bullish for stocks and
emerging markets, forgetting that past trends need not project very well into the future. In light of this I have written a series of posts on Bonds v/s Dollar Read on.
Bonds v/s Dollar -
I am rubbing it in but I made two posts on this in the last 2 months and i will not repeat everything there so here is a quick reference.
This explores the short term deviations between US bonds and the Dol,lar but the near term they are moving up and
down together http://www.indiacharts.com/icjpages/index.php/inter-market-analysis/7932-bonds-and-dollar-correlation-210418
This post made the outlook that is playing out that both markets will rise and then fall together. The rise part completed and bonds started to fall first, the dollar is at 61.8% retracement and near 92.50 may join the decline in the dollar. http://www.indiacharts.com/icjpages/index.php/inter-market-analysis/7790-bonds-and-dollar-correlation
So here is a still longer term chart from 1980. You should know that most theory and writings are made based on the past being extrapolated to the present. The inverse relationship between the dollar index and US bonds was a pre 2003 pattern. I think it has to do with Globalisation and the greater holding of US bonds by non US
investors. In other words it is nice to say that higher rates attract money pushing up the dollar but it is illogical. If foreign money is involved buying of bonds means yes dollar rises as money flows into the US but bond prices also rise on the buying of bonds. So logically in this case they should carry a positive correlation. And they mostly do for the last 15 years. They do not for short term periods of time especially when the dollars major trend is changing from up to down or down to up,
due to a lead lag between the two assets turning points. This has been circled on the chart. So the dollar sose from 2008-2016 and so did bond prices. During the last quarter of 2016 however bonds started falling first leading the way making the relationship appear inverted. But later both were falling.

These inversions also happen in the short term. So starting 2016 both bonds and the dollar are falling but in the short term many a time they appear to move in opposite directions. as marked on this chart. So during the last two weeks we
witnessed inversion again. But it will not last, the larger trend for both assets is lower, and the dollar has retraced 61.8% of the Oct-Jan decline, so the dollar is due to join the bond markets lower, and that can often be a self reinforcing trend as a falling dollar makes US bond markets less attractive to foreign investors.

I explain all this and what it means for our market in the coming months in the recently published Long Short report. Macro Analysis and Inter market relationships have never been this important in market forecasting as they are today. Get started
below.
The Truth About The Markets