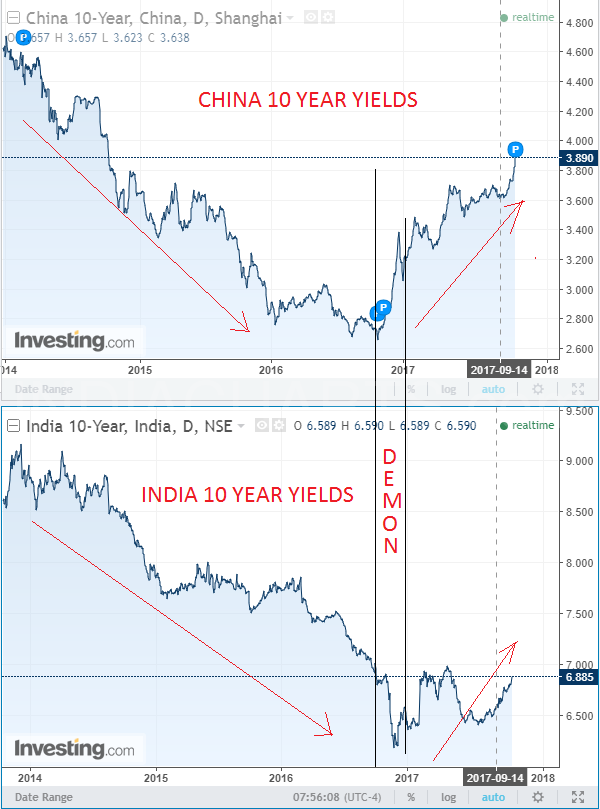
Using Channels EW and Bond yields.

Published: Tue, 10/31/17

October 31, 2017 View in browser

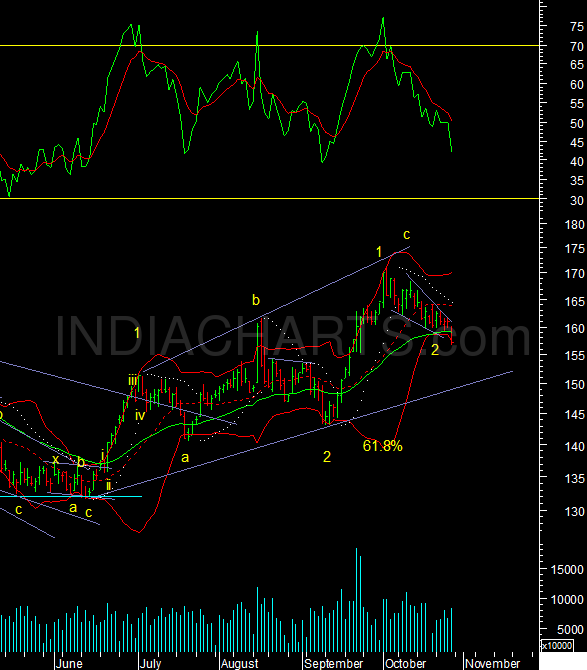
One Video an Outlook on Lead Prices as Metals rally nears exhausting. And Bond yields on charts in today's updates.

Image
www.indiacharts.com

My 4 minutes Video on the Use is Channels on the DJIA along with Elliott Wave Principles and the outlook for US Indices.

Image
www.indiacharts.com

Are global Bond yields correlated? In the environment of global liquidity flows most asset markets have become highly correlated. So just like equities we see similar trends in bond markets as well. Especially after India opened up its govt securities market. So you have been reading about the Chinese bond yields rising. So do they mean anything. Here is a chart of the Indian and Chinese yields on the 10 year on the same chart. What you see is the similarity in trends since 2014. Starting Mid of 2016 US bond yields started to rise and following that global bond yields are inching higher. The only reason we lagged behind is the direct intervention from Demonetisation that pushed liquidity into Indian banks and then from there to the bond markets. The chart shows how during that period the trends become inversely correlated. That done we are now see the relationships re-emerge. Bond yields are rising in China and so are they in India. They are not different from each other. RBI intervention apart these trends would continue.

Image
www.indiacharts.com

Lead Mcx ended the day below the 40dema, and that breaks a important support at 159. Staying below 159 the next support is at the trendline at 149, that comes from the June bottom.

Image
www.indiacharts.com

Indiacharts has been forecasting the markets freely from this blog since 2001. In June 2013 we launched the Insiders Program so that you can ride the markets up and downs as it happens everyday.

AWeber
Powered by Curate