IC News - Bitcoin DAX US Equities

Published: Tue, 01/02/18

January 2, 2018 View in browser

Learn to Use Channels.
My recent Podcast
The big move on the last day of 2017 and it's implications for US stocks.
DAX starts a 3rd Wave decline

m.soundcloud.com

Blow off rallies and market crashes are what we are looking at if Bitcoin is anything to go by.

Image
plus.google.com

Blow off rallies and market crashes are what we are looking at if Bitcoin is anything to go by.

Image
www.indiacharts.com

If you are an advanced user of Channels this video is apt for you and explains the state of the Dow today. If you are new to the subject then first read the rest of the article below on the use of EW analysis and channels for setting targets. It is simple and should get you started on a very simple technique that works on all time frames.

Image
www.indiacharts.com

Rohit Srivastava: ' This is a free update on the markets for public reading. My views are based on my analysis of the markets after years of such analysis, since 1991. Investment decisions made on the above analysis would be at your own risk and I take no responsibility for your decisions based on the above analysis.' Rohit Srivastava is an employee of Sharekhan limited, you may note that Sharekhan limited and/or its subsidiaries /group companies are not connected with this website in any capacity.

Image
www.indiacharts.com

Nasdaq - I did not expect it to change so fast - just last week it extended to a new high but the rally has ended quickly in 3 waves. Meaning the new high was a corrective move. This can only be true if the pattern is a triangle or complex fractal. The chart below shows a potential expanding triangle for the given time period in wave 5 and in this way wave 5 would appear complete on the Nasdaq and Dow, both closing down for the week. The implications of the expanding triangle are on the chart. The size of the pattern below the neckline.

Image
www.indiacharts.com

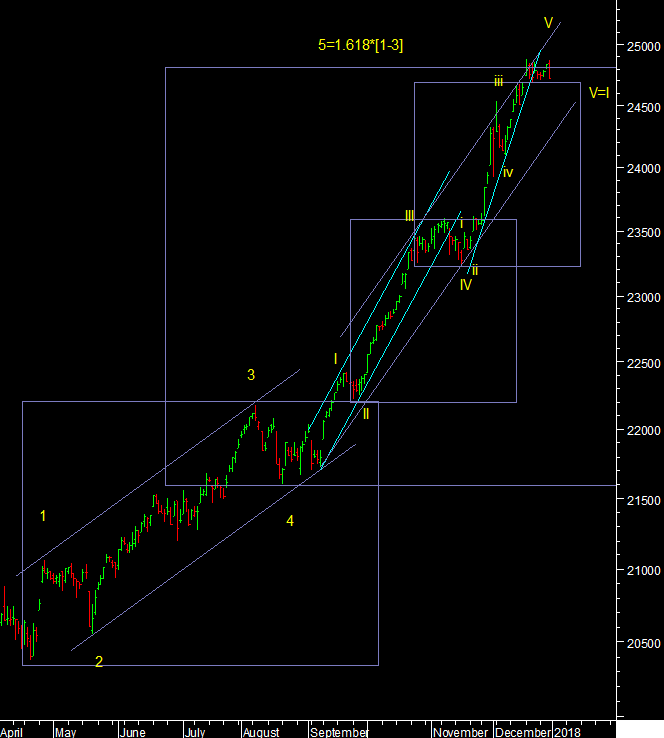
Dow - In my last 2 posts I discussed the channels that are defining the blow off phase of the Dow's 5th wave. The 5th wave has extended from one rising channel to the next that is steeper. This week prices finally topped at the top end of the second channel and broke below the blue trendline pushing the daily momentum to a sell and closing down for the week. All put together it puts a high probability on the idea that the 5th wave is over at this weeks high. Unless new evidence shows up that we have one more extension, it is over. Period. Fibonacci ratios also match well here. 5=1.618 times [1 to 3], or III of 5 = V of 5. Given that wave 5 was a blow off move, If the 5th wave is over the next move down should be just as one sided as the rise.

Image
plus.google.com

DAX broke the wave 1 lows along with the falling dollar - https://buff.ly/2EBUBbV - indiacharts - Google+